Posts

Showing posts with the label July

On-premises data gateway July 2022 update is now available

We are happy to announce that we have just released the July 2022 update for the On-premises data gateway (version  3000.134.9 ). This update doesn’t include changes to the data gateway application. Go to  On-Premises Data Gateway (standard Mode) download page. Go to  On-Premises Data Gateway (Personal Mode) download page. Compatible with July Power BI Desktop

ExecuteQueries REST API versus XMLA endpoints at scale

Image
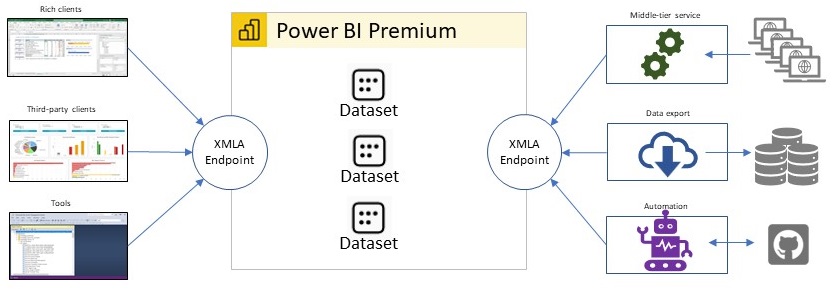
Thanks to the ExecuteQueries REST API reaching general availability (GA), we’re seeing an increase in custom solutions that query Power BI datasets. We’re also seeing more questions in the Power BI community concerning the main usage scenarios that this API enables. The ExecuteQueries API broadens the reach of business solutions that use Power BI datasets, but there are important limitations. As mentioned in the blog post Unlocking new self-service BI scenarios with ExecuteQueries support in Power Automate, the ExecuteQueries API is a great choice for retrieving small chunks of data, automating dataset testing, and implementing BI-driven cloud solutions, among other things. One key characteristic that these scenarios have in common is that they work at a small scale. For example, the ExecuteQueries API restricts query results to 100,000 rows or 1,000,000 values per query (whichever is encountered first), so it is clearly not the right choice if you want or need to retriev...

Visualizing views in Dynamics 365 with Power BI is now generally available

Image
We’re very excited to announce that the Power BI integration in Dynamics 365 and model driven Power Apps, which shipped as a preview last December, is now generally available. Dynamics 365 and model driven Power Apps give organizations the ability to quickly build essential line-of-business apps in a low-code environment, increasing agility and modernizing processes. Since these apps are all built on top of Dataverse, they’re backed by your core business data. With this integration directly on views, information workers are now able to tap into this data and explore it using Power BI’s powerful data analytics capabilities without ever needing to leave their app. Just click the ‘Visualize this view’ button and let Power BI automatically create a report on top of the exact data you were looking at. Of course, with this integration moving to general availability, there are lots of new features as well. Read on to learn about all the recent improvements. Saving reports to the Powe...

Data Analytics Training Course - July 30th, 2022

Companies across all industries are in need of data thinkers. Jobs of the future will require employees who are equipped to understand, categorize, and report data insights to all levels of their organization. Our courses combine instructor-led lessons with project-based assignments. Flexible 6-to-12 week courses On campus and online offerings Dedicated instructors with real-world experience On-the-job support for a year after graduation Job interview practice workshops Curriculum Built to Help You Succeed Phase I: Technical Training Module 1: SQL Server Module 2: SSRS Module 3: SSIS Phase II: Career Accelerator Program Module 1: Portfolio Creation Module 2: Interview Practice Register:  Data Analytics Training Course - July 30th, 2022

“Data in space” in preview: Now Power BI can be truly everywhere

Image
We live in a connected world and almost everything around us generates data. Imagine if you could view that data, processed and with insights, in the context where it was created. Now, with Power BI Mobile app, you can. Data in space  is a new Power BI Mobile feature that uses augmented reality to create spatial anchors in the real world and attach Power BI data to them, so that data can be connected to the physical environment it describes. Using Data in space, you can connect your business data to your real-world scenarios, such as facility management, manufacturing, or retail. Employees can then easily discover and use it for better, and more informed decision making. How does it work? We’ve partnered with the Azure Spatial Anchors team to integrate Azure Spatial Anchors within the Power BI Mobile iOS app. Azure spatial anchors technology enables the app to understand spaces, mark specific places of interest, and remember those points of interest. It then allows the app to searc...
Improved Power BI Experience in Excel

Image
We are excited to announce improvements to the  Power BI experience in Excel  that will help business users easily search data artifacts (including Power BI datasets and Power BI datamarts) and uncover better data insights all inside a spreadsheet environment. These improvements are rolling out to users in phases and will complete over the next few days. With these new changes to the Power BI experience in Excel, you can: Easily search for data in a new user-friendly interface Discover new data artifacts with a deep link to the Power BI Data hub where you can find recommended datasets and other trusted data in your organization Derive additional insights from your data with direct links to Power BI reports from inside Excel Power BI has become the central data repository for many organizations and now you can access all that data right inside Excel. Better Search in User-Friendly Interface The new Power BI UI in Excel is a significant improvement from the prior interface ...

Power BI July 2021 Feature Summary

Image
Here is the full list of July updates:   Reporting Small multiples   Conditional formatting for more properties Power BI’s built-in visuals now include the Power Automate visual   Sensitivity labels in Power BI Desktop   Republish PBIX with option to not override label in destination. Inherit sensitivity label set to Excel files when importing data into Power BI Modeling New Model View   DirectQuery for Azure Analysis Services & Power BI datasets Updates   Data connectivity Amazon Athena (new connector) Databricks (updated connector) Dremio (updated connector) MariaDB (updated connector) Service Streaming dataflows   Mandatory label policy   Custom help link for sensitivity labels Datasets hub improvements Goals support in lineage view Scanner API (Admin REST APIs) enhancements to include dataset tables, columns, measures, DAX expressions, and mashup queries  Visualizations New visuals Charticulator (custom visual vers...