Posts

Showing posts with the label Metrics

Power BI Metrics: Hierarchies performance tips

Image
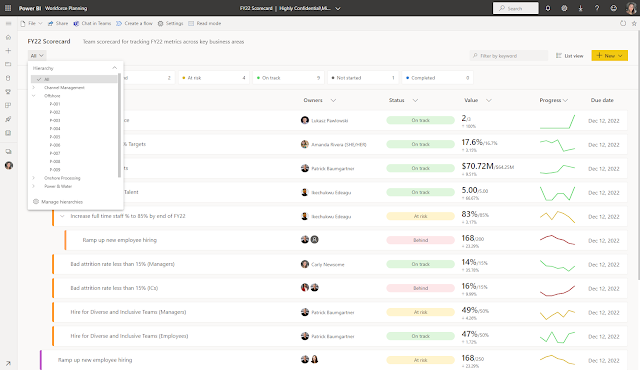
Power BI Hierarchies performance tips and tricks Today we are excited to talk about some tips and tricks for improving load performance of hierarchies in Power BI. Hierarchies in scorecards is a hugely powerful tool, so let’s talk about how to optimize content load times for your users and make cascading scorecards as useful as possible. First, some background. What is ‘hierarchies’? Power BI Metrics enables ‘cascading scorecards’ that roll up along hierarchies in your data. You can set up a hierarchy for a scorecard and map the Power BI datasets referenced by your metrics to the hierarchy levels and owner fields, automatically creating a new scorecard view for each slice of your data. That’s potentially thousands of automated scorecard views with just a few clicks. Power BI will cascade connected metric values to each level of the hierarchy. Users can easily drill into the hierarchy to see progress, statuses and do check-ins at different levels. In the images below, you can see the di...

Viva Goals + Metrics integration, scorecard time zones

Image
New year, new features! We are excited to announce the general availability of the Viva Goals Power BI integration and three new Metrics features specifically answering common customer asks. A new, optional column for milestones, scorecard time zones, and a handy auto collapse / auto expand feature. Let’s take a look. Next milestone column: In the last few months, we released a feature that allows you to add multiple milestones to a metric. Previously, we showed either the final target or the next milestone in the scorecard, depending on the user selection. With this new release, users can show an entire column dedicated to showing the next milestone, as well as the final target if they choose. You can access these options in the column view settings shown below. You can also use the toggle to show a combined current/target value as the progress column or opt to separate the values into a current and target column. As you can see below, I have individual columns for current, next miles...

Announcing: Enterprise scorecards with hierarchies and linked metrics in Power BI Metrics

Image
Metrics in Power BI lets customers curate their metrics and track them against key business objectives all in one place, enhancing data culture by promoting accountability, alignment, and visibility for teams and initiatives within organizations. We are excited to finally announce two much anticipated releases in our Metrics experience. With  hierarchies and linked metrics , it’s easier than ever to automate your metric values so you can spend less time crafting multiple scorecards and connections, and more time analyzing your metric performance. Hierarchies is a premium or PPU feature, and linked metrics is a Pro feature. These two features enable easy, large scale enterprise scorecard deployment, allowing automated views of cascading scorecards and linked metrics that show up and are sync’d on multiple scorecards. Let’s take a look at how you can create your widespread scorecard solution: Cascading scorecards with hierarchies: Let’s start with hierarchies. This is a premium featu...

Announcing submetric roll ups in Power BI Metrics

Image
Metrics in Power BI lets customers curate their metrics and track them against an organization’s KPIs all in one place, enhancing data culture by promoting accountability, alignment, and visibility for teams and initiatives within organizations. We are excited to announce a much anticipated release in our Metrics experience: With  submetric   roll ups , it’s easier than ever to aggregate your metric values so you can spend less time crafting multiple scorecards and connections, and more time analyzing your performance. Submetric roll ups: Previously, there was no way to aggregate a group of submetrics’ values to the parent metric. You could work around this by connecting all metric values to data, but to  automatically  roll up these values to a parent metric couldn’t be done. Now, with the release of current and target roll ups, you can set automatic aggregations of your submetric values to show in your parent metric. You can select from aggregation types of sum, av...